test
inkscapeへの吐き出し
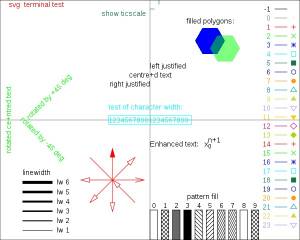
set terminal svg
set output 'hoge.svg'
でプロットをして吐き出せば,svg形式のファイルが出力される. ただ,出力されたファイルはsvgのタグが閉じられていない. そのため,最後の行に</svg>という文を挿入する必要あり.
echo "</svg>" >> hoge.svg
デフォルトのまま出力すると文字が小さいので、
set terminal svg fsize 15
などとするとよい。デフォルトのfsizeはだいたい12くらいのようだ。
inkscapeから吐き出すと凡例が動かせない?
矢印を二番目のやつ(ノードでパスを編集)にして、凡例の端っこ2点をshiftを押しながらクリック。 両端が青色になったら矢印キーあるいはctrlを押しながらマウスで動かせます。 http://www.iim.ics.tut.ac.jp/~yamawaki/inkscape/gnuplot.htmlが分かりやすい。
関数を定義
gnuplot内で関数を定義することができる。例えば(0次)第一種球ハンケル関数をプロットしたければ、
gnuplot> zbesh0real(x)=-cos(x)/x
gnuplot> zbesh0imag(x)=sin(x)/x
gnuplot> plot zbesh0real(x),zbesh0imag(x)
などとやれば良い。よく使う関数はそのまま~/.gnuplotに書いておけば良い.
zbesh0real(x)=-cos(x)/x
zbesh0imag(x)=sin(x)/x
2種類の軸を書く
2種類のデータをプロットする時に軸のスケールが大幅に違うとき。
gnuplot> set yrange[-0.9:1.1]
gnuplot> set y2range[0:1]
gnuplot> set y2tics
gnuplot> plot "data1.res" axes x1y1, "dat2.res" axes x1y2
この例だと、左側に[-0.9:1.1]、右側に[0:1]の目盛が現れる
2つのファイルの差分を表示する
直接波と反射波が入ったデータから、直接波のデータを引く場合など。 プログラムを作らなくともgnuplotで差を書き出すことができます。
sampleA.dat、sampleB.datの1列目は同じもの、2列目を比べたい場合
gnuplot> plot "< paste sampleA.dat sampleB.dat" using 1:($2-$4) with lines
などと書きます。
シェルコマンド“paste”を使うことで、sampleA.datとsampleB.datを一つのファイルと見なし、 その1列目をx軸、2列目、4列目(もともとsampleB.datの2列目だったもの)の差をy軸に表示させています。


